How to Build a Dashboard with AI (No Analyst Needed)

On this page8 sections
- What You Need Before You Start
- Which AI Dashboard Tool Should You Use?
- Step-by-Step: How to Build a Dashboard with AI No Analyst Needed
- Step 1 — Pick your data source
- Step 2 — Sign up for a no-code AI dashboard tool
- Step 3 — Upload or connect your data
- Step 4 — Describe the dashboard you want in plain English
- Step 5 — Review, adjust, and share
- Common Mistakes to Avoid
- Pro Tips
- Best AI Tools to Build a Dashboard Without a Data Analyst
- Anomaly AI — Best for freelancers and agencies doing client reporting
- Zoho Analytics — Best for a permanently free, drag-and-drop dashboard
- Polymer — Best for fast, branded dashboards from ad platforms
- Frequently Asked Questions
- Conclusion
- You don't need to hire a data analyst or learn SQL to get a working dashboard — no-code AI tools build one from a file upload or a plain-English prompt
- AI app-builders (Lovable, v0) and no-code AI BI tools solve different problems — this guide covers the true no-code path, not custom-coded apps you have to host yourself
- Anomaly AI's free tier (60 credits/month, roughly 8 dashboards) generates dashboards from plain-English queries at no cost — no upgrade required to use its AI
- Zoho Analytics' free plan is permanently free (2 users, 10,000 rows, unlimited dashboards) for drag-and-drop dashboards, but its AI assistant Ask Zia requires the $145/mo Premium plan
- The right tool depends on whether you're reporting to clients, tracking your own numbers for free, or pulling data from ad platforms
How to Build a Dashboard with AI (No Analyst Needed)
According to goLance's freelance hiring rate guide [OPEN IN NEW TAB], a freelance data analyst runs $40-120 an hour for junior-to-mid-level work, and a full-time hire is a five-figure commitment most solo businesses can't justify for a handful of numbers they just want to check every week. Here's how to build a dashboard with AI without hiring a data analyst instead: a no-code AI dashboard tool can turn a spreadsheet or a connected account into real charts and KPIs in about ten minutes.
This guide walks through the exact process, then splits the tool recommendation three ways depending on what you're actually trying to track.
What You Need Before You Start
- Your data in a usable form — a spreadsheet/CSV export, or a connected account like Google Analytics, Shopify, or your CRM. No cleanup required for most tools.
- A free account with a no-code AI dashboard tool — Anomaly AI is the easiest starting point for genuinely free, AI-generated dashboards, no credit card needed.
- 10-15 minutes for your first working dashboard.
If you only need to answer one question rather than build an ongoing dashboard, our step-by-step guide to analyzing a CSV file with AI covers that narrower, faster path.
Which AI Dashboard Tool Should You Use?
| Tool | Best For | Free Plan | Price (USD/mo) |
|---|---|---|---|
| Anomaly AI | Freelancers/agencies doing recurring client reporting | Yes — 60 credits/month (~8 dashboards), AI included | $25 (Pro) |
| Zoho Analytics | Solopreneurs wanting a permanently free, drag-and-drop dashboard | Yes — 2 users, 10,000 rows, unlimited dashboards (AI assistant needs Premium) | $30 (Basic) |
| Polymer | Fast, branded dashboards pulled from ad platforms | 7-day full-feature trial, no ongoing free tier | $500+ (API Access) |
Quick sanity check before you pick one: if what you actually want is a fully custom, coded application, an AI app-builder like Lovable or v0 is a different tool for a different job — you'll be connecting a database and hosting the result yourself. Everything below is the true no-code path, where you upload data or connect an integration and get a finished dashboard with nothing to maintain.
The walkthrough below uses Anomaly AI as the example, since its plain-English AI querying works on the free tier without an upgrade. If you want the full tool-by-tool comparison first, check out our roundup of the best AI data analytics tools, or browse the AI Data and Analytics category directly.
Step-by-Step: How to Build a Dashboard with AI (No Analyst Needed)
Step 1 — Pick your data source
Decide whether you're uploading a file (CSV or Excel export) or connecting a live source like Google Analytics, Shopify, or a CRM. A file works fine for a one-time or monthly dashboard; a live connection is worth it if you want the numbers to update on their own.
Step 2 — Sign up for a no-code AI dashboard tool
Create a free account with Anomaly AI. No credit card, and its 60 monthly credits give you the AI querying and dashboard generation right away — no plan upgrade needed to reach the AI features.
Step 3 — Upload or connect your data
Drag in your file or authorize the integration. The tool scans column headers and data types automatically — you don't need to tell it what anything means.
Step 4 — Describe the dashboard you want in plain English
This is the part that used to require an analyst. Instead, just type what you want to see: "Show me monthly revenue, my top 5 clients by billing, and any outstanding invoices." The AI reads your data and generates the matching charts on its own.
Step 5 — Review, adjust, and share
Swap a chart type if a bar chart would read better as a line, add a filter for date range, and generate a shareable link — or set it to email you a scheduled report. No design skill required.
Common Mistakes to Avoid
- Starting with too many metrics at once. Pick the one question you actually want answered first ("what's my revenue trend?"), get that dashboard right, then add more.
- Uploading messy data without a quick scan. AI cleans up formatting inconsistencies, not fundamental errors — duplicate rows or mislabeled columns will still throw off the result.
- Reaching for an AI app-builder when you just need a dashboard. Lovable and v0 are great for building custom software, but they add setup and hosting you don't need for a simple recurring dashboard. Save that route for when you need something genuinely custom.
Pro Tips
- Set up scheduled report delivery (email or Slack) so you check the dashboard passively instead of remembering to log in.
- Save your first prompt as a template. If you're asking a version of the same question every month, reuse it instead of starting from scratch.
- Treat hitting a free-tier limit as a growth signal, not a problem. If you outgrow 10,000 rows or 60 credits, that means your reporting has actually grown — it's not a reason to jump straight to an enterprise BI platform.
Best AI Tools to Build a Dashboard Without a Data Analyst
Anomaly AI — Best for freelancers and agencies doing client reporting
Anomaly AI turns Excel, CSV, GA4, and ad-platform data into dashboards, PowerPoint slides, and scheduled PDF reports, with every number traceable back to its source. That traceability matters when a client asks "where did this figure come from" — and unlike some competitors, the AI querying itself runs on the free tier, not a paid upgrade.
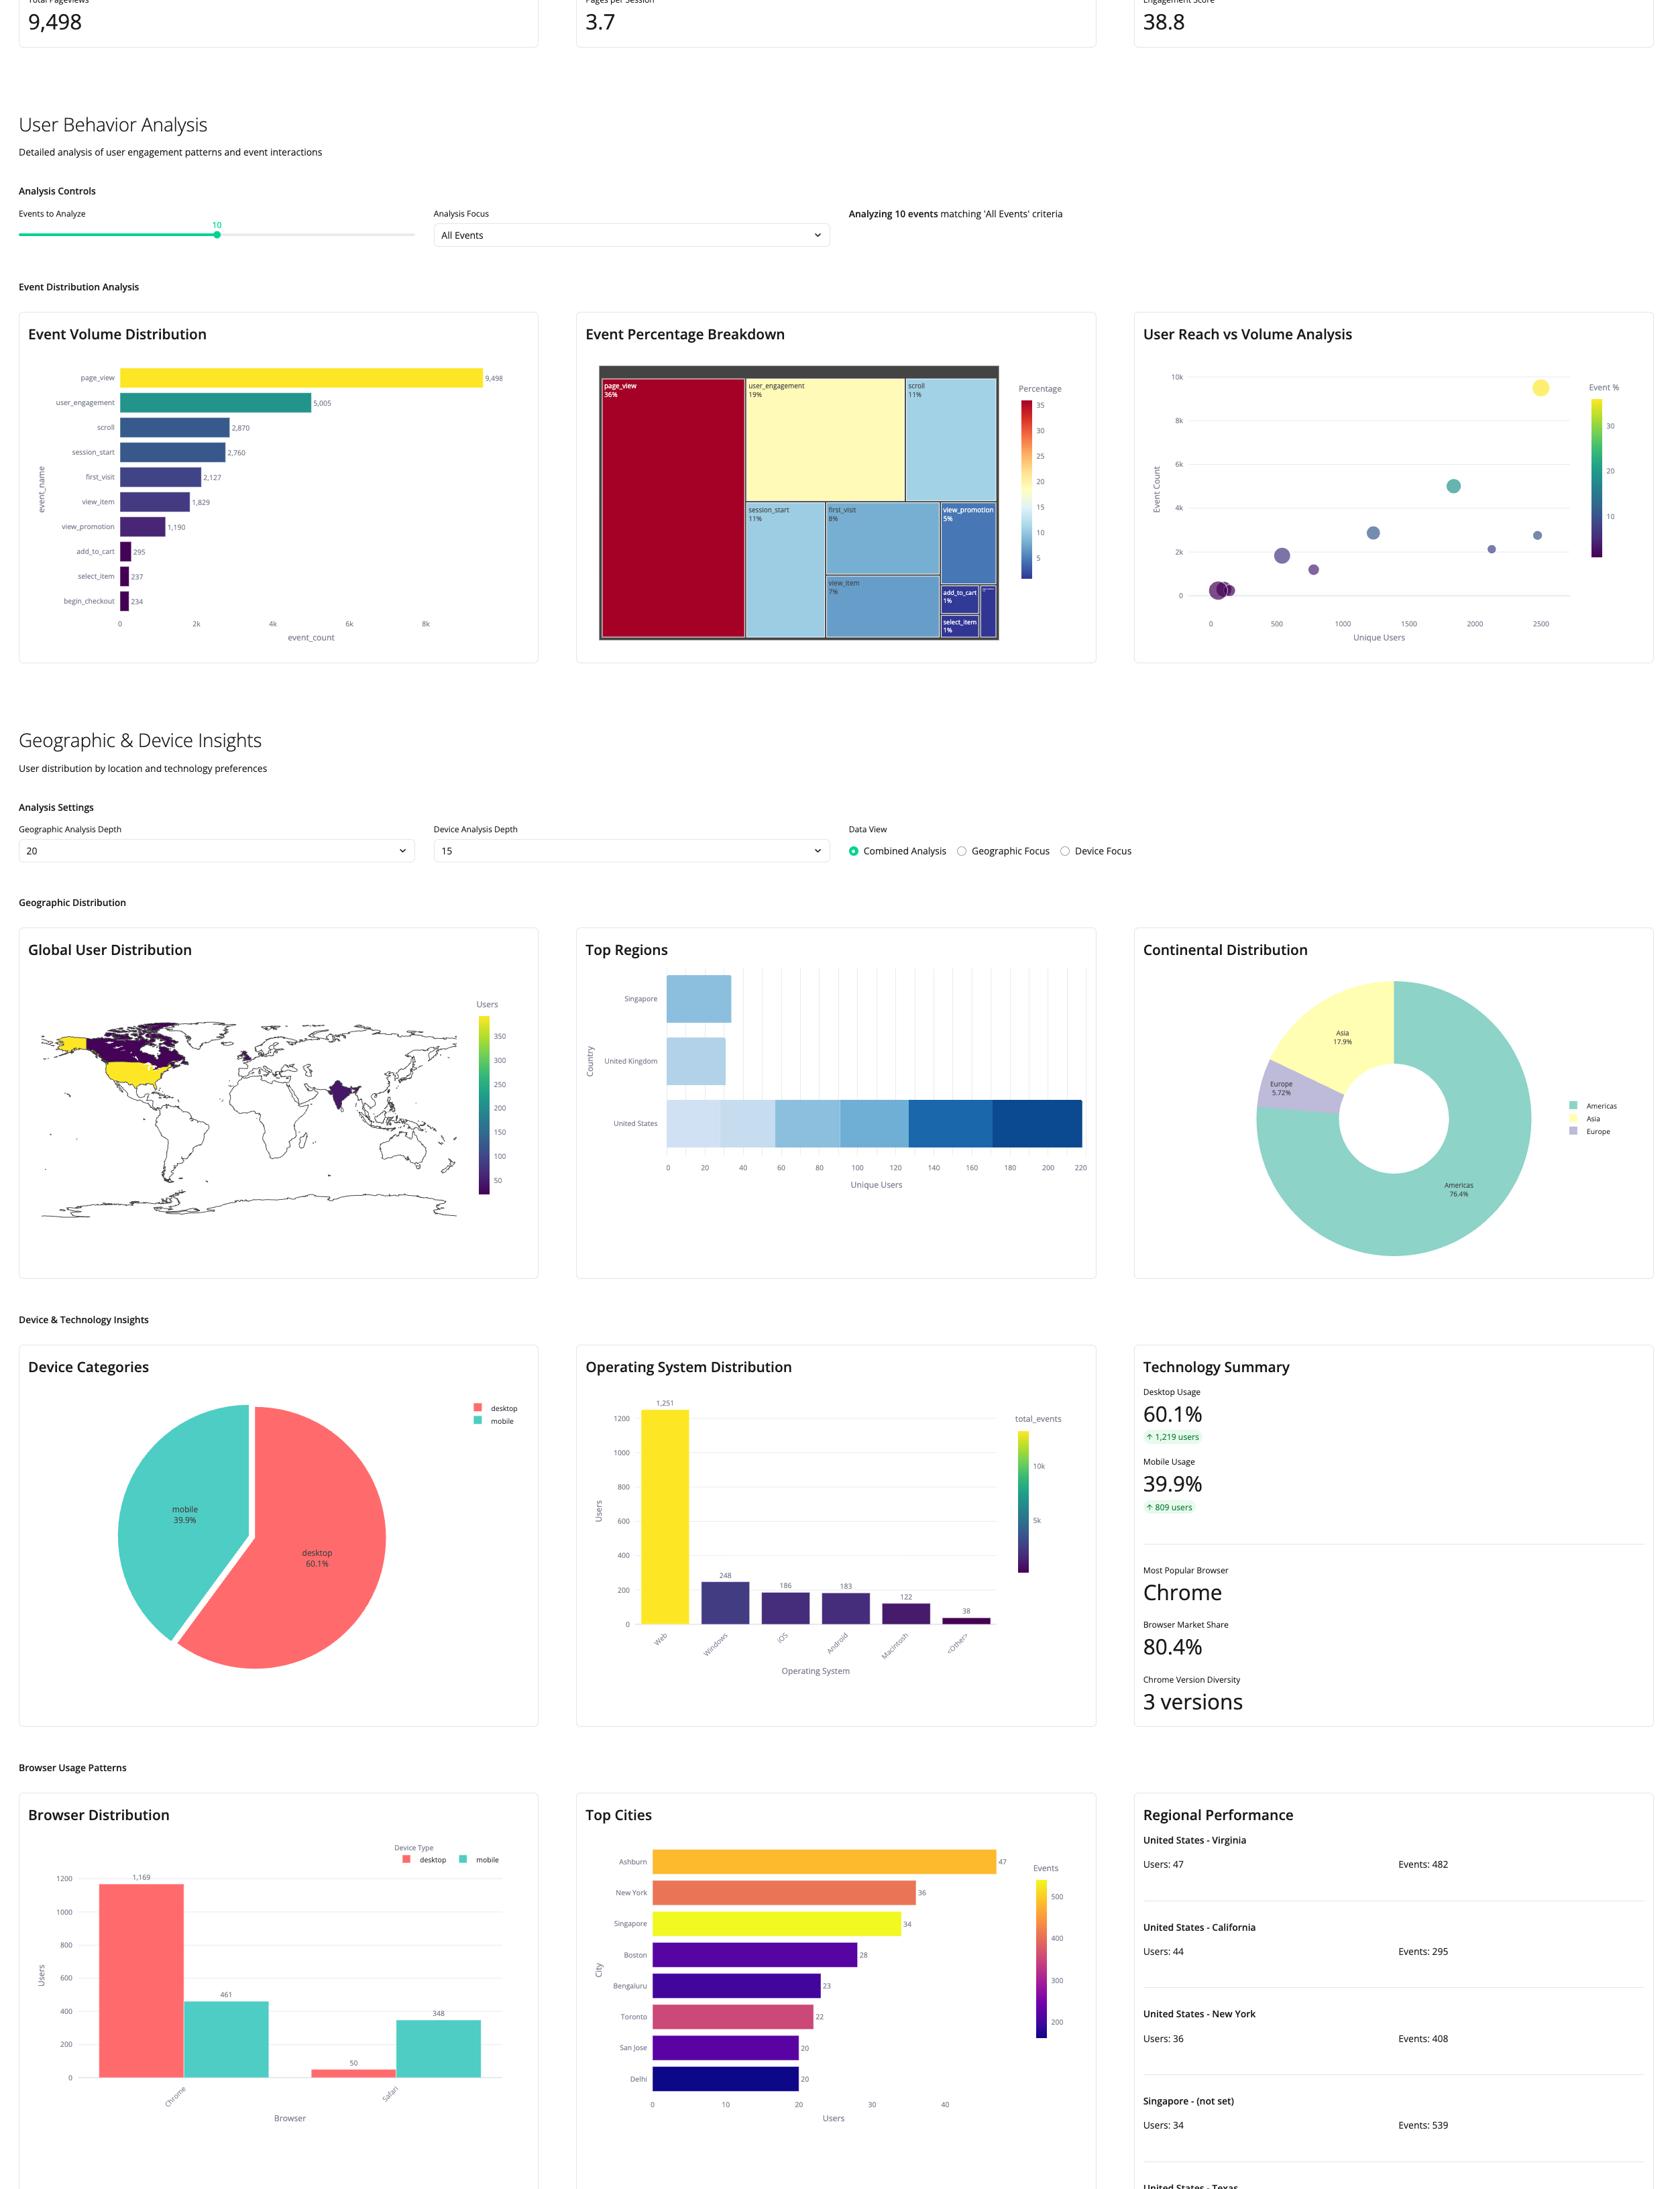
Not ideal for: real-time or streaming monitoring — Anomaly AI is built for batch and scheduled analysis, not live alerting.
Zoho Analytics — Best for a permanently free, drag-and-drop dashboard
Zoho Analytics is a self-service BI platform with a genuinely permanent free tier — 2 users, 10,000 rows, unlimited dashboards, no credit card and no trial expiration. Worth knowing upfront: its AI assistant, Ask Zia, is not part of that free tier — it's locked to the $145/mo Premium plan.
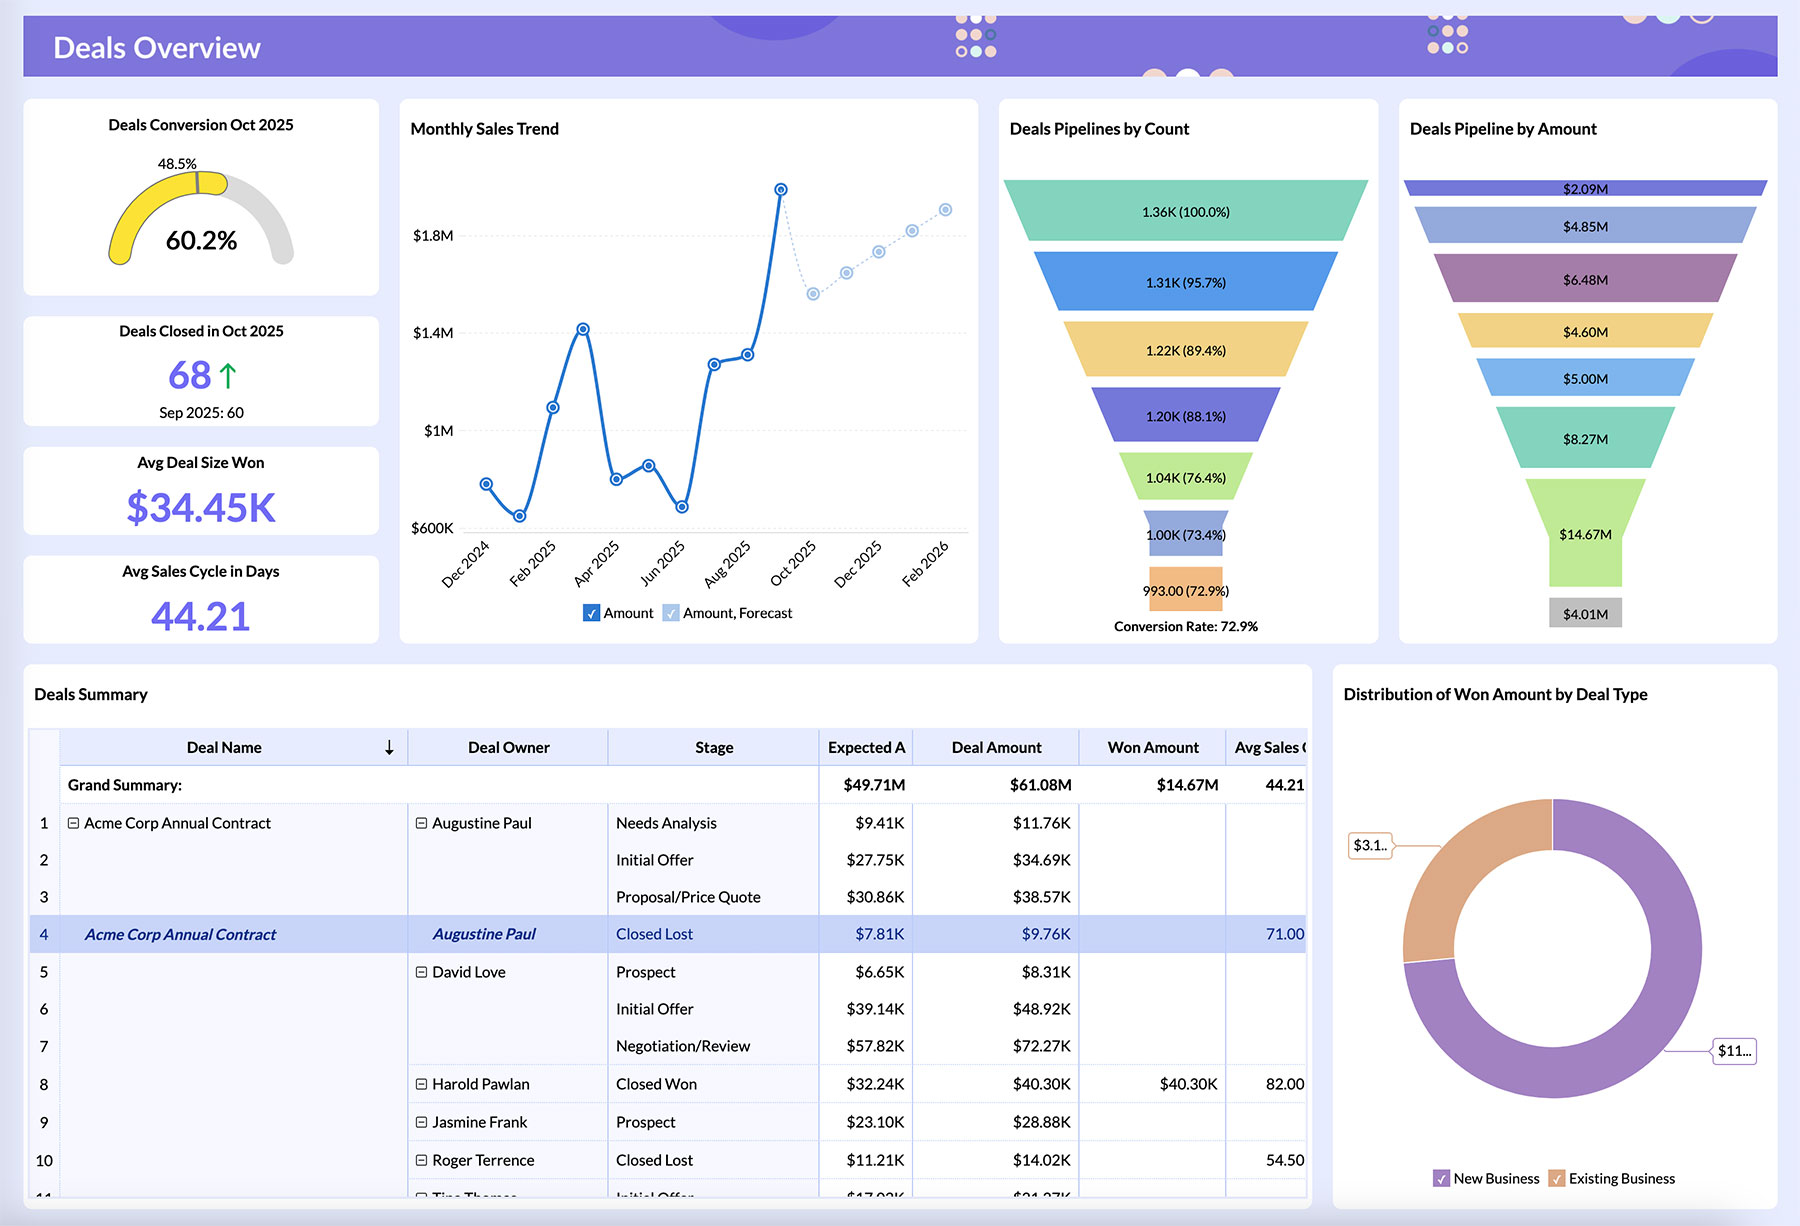
On Free, you're building dashboards with Zoho's drag-and-drop editor instead of a plain-English prompt, which is still genuinely no-code, just not AI-driven. For the complete breakdown of what is and isn't included, see our full Zoho Analytics free plan limits guide.
Not ideal for: anyone who specifically wants free AI-prompted dashboard building — that requires Premium, or a tool like Anomaly AI that includes AI in its free tier.
Polymer — Best for fast, branded dashboards from ad platforms
Polymer turns spreadsheets and ad accounts (Google Analytics, Facebook Ads, Shopify) into interactive, brandable dashboards you can hand to a client without them seeing your tool's default styling.

Not ideal for: anyone who wants a permanently free option — Polymer's free access is a 7-day trial, not an ongoing tier, so evaluate it before you commit.
Frequently Asked Questions
Can I build a dashboard with AI for free? Yes. Anomaly AI's free tier includes 60 credits a month (roughly 8 dashboards) with its AI querying included, and Zoho Analytics' free plan supports 2 users and 10,000 rows with unlimited dashboards — both with no credit card required.
Do I need to know SQL or coding to build a dashboard with AI? No. Anomaly AI and Polymer both accept a plain-English description and generate charts and KPIs without any query language. Zoho Analytics' free-tier dashboard builder is also code-free, though it's drag-and-drop rather than AI-prompted — its AI assistant Ask Zia requires the paid Premium plan.
What's the difference between an AI dashboard builder and an AI app builder like Lovable? An AI app builder generates a custom coded application you have to connect to a database and host yourself. A no-code AI BI tool is a finished platform — you upload data or connect an integration and get a working dashboard immediately, with nothing to maintain.
Can AI build a dashboard from a spreadsheet or CSV file? Yes. Anomaly AI and Polymer both generate a dashboard directly from a spreadsheet or CSV upload using AI. Zoho Analytics accepts the same upload but builds the dashboard through its drag-and-drop editor on the free tier rather than an AI prompt.
Conclusion
If you're reporting to clients on a recurring basis, start with Anomaly AI — its scheduled, source-traceable reports save you from rebuilding the same dashboard every month by hand, and the AI querying is free from day one. If you just want a permanently free dashboard for your own numbers and don't need the AI prompt specifically, Zoho Analytics' free tier is generous enough that most solo businesses never need to upgrade.
Either way, the analyst you were about to hire isn't the only path to a working dashboard anymore.